
FRANK Command for consumer brands
Every channel, every dollar, every day of stock.
Net revenue across Amazon, your own store, TikTok Shop and distribution, counted once; what you keep after costs; repeat customers; and how many days of stock you have left.
FRANK Command
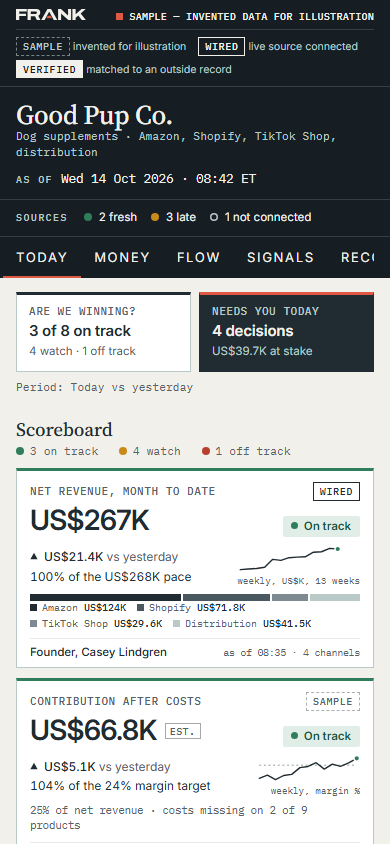
Are we winning? What needs me today? One screen answers both.
Sample — invented data for illustration.
The tiles
What each tile tells you.
| Tile | What it tells you |
|---|---|
| Net revenue by channel | Amazon, Shopify, TikTok Shop and distribution as one strip, against target; each sale counted once |
| Contribution after costs | After cost of goods, platform fees, shipping and ad spend; tagged “estimate” until the cost of goods is complete |
| Blended efficiency | Blended return on total marketing spend, new-customer cost, and spend versus return by channel in one row |
| Repeat and subscribers | 30/60/90-day repeat; Subscribe & Save and Shopify subscribers |
| Stock cover | Days of cover per top product, next reorder date against supplier lead time, stock sitting with distributors |
| Distribution | Open orders, sell-in versus sell-through, reorder prompts, receivables |
| Reputation and account health | Rating, review velocity, Amazon Account Health status, supplement-claims flags |
For supplements, the claims check shows as a status.
What it catches
What goes amber or red.
- 01
Buy Box loss
- 02
Under 30 days of cover on a top product
- 03
Ad spend above its band
- 04
A rating drop
- 05
A video outperforming (a green opportunity)
What we wire first
Week one: your sales channels, ad accounts and inventory.
Get your sample Command.
Your first sample is free, built before you commit to anything. Nothing to install — email and a browser.